GRI Indicators
Indicators in this page
Employee Profile
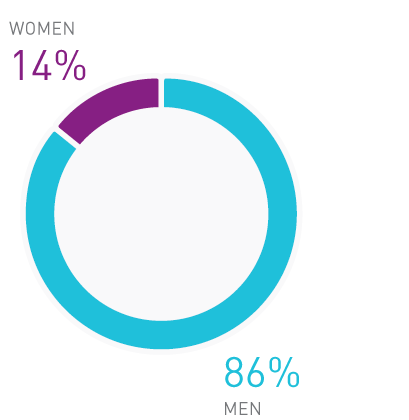
Our team totaled 29,557 employees in March 2017. Most of them work in the Southeastern region, where 93% of our workforce is concentrated. The significant variation in the number of jobs over the period is mainly due to the beginning and end of the harvest. During the 2016/2017 crop year, the highest turnover rates were in the months of April 2016 and March 2017, with a high number of admissions in April/2016 and a high number of terminations due to the end of the harvest in the month of December 2017. May 2016 was the month with the largest number of active employees and employees on leave in our operations.
The numbers of the 2016/2017 harvest refer to March 2017, the final month of the harvest. Third parties, apprentices and interns were not considered. In the previous harvests, the total number employees had been accounted for at the height of the harvest, which resulted in a change in the way the indicator was calculated.
| 2014/2015 Harvest | 2015/2016 Harvest | 2016/2017 Harvest | |
| Men | 33,377 | 29,847 | 25,547 |
| Women | 5,195 | 4,540 | 4,010 |
| Total | 38,572 | 34,387 | 29,557 |
| 2014/2015 Harvest | 2015/2016 Harvest | 2016/2017 Harvest | |||||||
| Full-time¹ | Part Time | Total | Full-time¹ | Part Time | Total | Full-time¹ | Part Time | Total | |
| Men - open-ended contract | 31,013 | 32 | 31,045 | 26,367 | 34 | 26,401 | 23,684 | 31 | 23,715 |
| Women - open-ended contract | 4,854 | 15 | 4,869 | 4,131 | 18 | 4,149 | 3,927 | 20 | 3,947 |
| Men - fixed-term contract2 | 2,332 | 0 | 2,332 | 3,446 | 0 | 3,446 | 1,832 | 0 | 1,832 |
| Women - fixed-term contract2 | 326 | 0 | 326 | 391 | 0 | 391 | 63 | 0 | 63 |
1Full time considers over 150 work hours/month.
2All employees with temporary contracts work full time.
| 2014/2015 Harvest | 2015/2016 Harvest | 2016/2017 Harvest | ||||
| Men | Women | Men | Women | Men | Women | |
| South | 248 | 25 | 216 | 20 | 225 | 22 |
| Southeast | 31,110 | 4,930 | 28,009 | 4,296 | 23,761 | 3,781 |
| Midwest | 1,743 | 219 | 1,318 | 197 | 1,233 | 178 |
| Northeast | 187 | 16 | 202 | 19 | 204 | 18 |
| North | 89 | 5 | 102 | 8 | 124 | 11 |
Supplier Chain
For our logistics operations, we hire carriers responsible for handling fuel and sugar. For commercial operations, suppliers are divided between those that deliver fuel to retail and B2B clients and those who pick up products at the units and supply the terminals. There are also carriers that carry out these two operations.
In the sugar chain, suppliers are divided between those that deliver to the domestic market (handling to B2B clients) and those that provide service to the foreign market (handling at port terminals). They are present in all regions in Brazil, with the majority in the South and Southeast. In 2016/2017, approximately BRL 1.77 billion was spent on these contracts.
For hiring a new carrier, a first approval inspection is conducted by the Safety, Health and Environment (HSE) team. At this stage, the candidate loses one point for each non-compliance with criteria required based on the Highway Transports Manual (MTR) and on the Integrated Operations Management System (SIGO).
These criteria include, for example, compliance with current legislation, the contribution of these companies to reducing environmental impacts and the guarantee that their employees perform their activities in a safe manner.
After hiring, the inspection is conducted periodically (minimum annually and maximum biannually, depending on the result of the previous inspection) in order to ensure maintenance of the performance.
Our team conducts monthly verification of the performance indicators of these suppliers. They identify the number of controllable and uncontrollable accidents, high potential accidents and number of employees with some type of injury, as well as the severity of the occurrence. If an indicator reveals loss of quality in the operation, the coordinators of the carrier are notified to intervene. We also implement action plans to correct the problem. In cases of recidivism or lack of improvement, there is the possibility of contractual termination of the service.
In the 2016/2017 harvest, 100% of the new carriers for logistics operations were selected based on social and environmental criteria, and all suppliers were subjected to assessments, inspections, audits or other types of process to identify social and environmental impacts. Of these, 11 suppliers (25% of the total) caused actual impact. There was one LTI/LTIF (Lost time injury) accident, three TRC/TRCF accidents, six spills in an uncontained area and seven high potential controllable accidents.
In the same period, an operations contract was terminated. The carrier's breach rate was nearly 25 times above the goal, and its actions to reduce impacts were not having the necessary effect within the agreed upon time frame.
Supply chain management
The Procurement area is responsible for providing the equipment, materials and services used in all our production and non-production processes - among which are automotive items, Personal Protective Equipment (PPE), technical services, industrial replacement material, logistics services, corporate benefits materials and services, Information Technology and Infrastructure, materials and services for fuel logistics and distribution operations, marketing, materials and services for marketing of fuel at service stations and airports, chemical inputs, agricultural inputs and packaging. Approximately BRL 3.56 billion was spent, of which BRL 2.3 billion was spent on materials and the rest on services - 82% of purchases were made in the State of São Paulo.
We evaluate the Certificates of Good Standings (CNDs) of the suppliers that present high risk to our production process and whether they are included in the list of slave labor, published by the Ministry of Labor and Employment (MTE). When an irregularity is detected, our units open a Non-Conformity Report, and the Supplier Management area contacts the supplier to record an action plan. In addition, we carry out audits on hiring processes to detect possible irregularities. In these cases, the supplier is contacted and instructed to send us an action plan for improvements.
Suppliers are monitored for quality and timely delivery. With those who do not present a good performance, meetings are held to record a formal action plan. If their indices are not improved, the Procurement management assesses possible consequences such as termination of contract or application of fines.
Another measure adopted by the Supplier Management area in accordance with our anti-corruption practices is the monthly verification of active suppliers in the National Registry of Punished Companies (CNEP) and in the National Registry of Blacklisted and Suspended Companies (CEIS). Registers of suppliers included in these lists are suspended. The monthly monitoring also checks on the suppliers with the worst indices, especially those that have caused some type of impact on HSE - with which measures and actions are established to correct and prevent the problems identified.
Newsletters are sent quarterly, through which we share relevant information such as changes in legislation, supply strategies, news about the business, guidelines for meeting legal requirements and internal procedures.
Starting in the 2016/2017 harvest, the Supplier Management team has in place a Supplier Recognition Program, in which those with the best scores in the previous harvest are invited to receive a trophy, awarded in an event specially for this purpose.
In the same period, all new suppliers hired by the Procurement area were selected based on social and environmental criteria. A total of 1,176 suppliers were evaluated and registered and went through all stages of the training process according to the criteria defined in the procedure.
In parallel, 339 strategic suppliers - evaluated and registered on the database in previous periods - participated in the performance monitoring (IQF). Of these, 26 were blocked because they did not meet the minimum requirements for timeliness and quality. However, none was blocked for negative, significant or effective impacts in relation to social and environmental criteria.
In this harvest, 156 suppliers were systematically blocked for new purchases under our Procurement process: 141 were included in the National Registry of Blacklisted and Suspended Companies, six were cited in acts of corruption, and ten were included in the list of slave labor of the Ministry of Labor and Employment (MTE).
Memberships in trade associations and national or international advocacy organizations
União da Indústria de Cana-de-Açúcar (UNICA)
Associação Brasileira de Biotecnologia Industrial (ABBI)
Associação da Indústria de Cogeração de Energia (Cogen)
Centro das Indústrias do Estado de São Paulo (Ciesp)
Fundação Getulio Vargas (FGV) – Iniciativas empresariais
Sindicato Nacional das Empresas Distribuidoras de Combustíveis (Sindicom)
Associação Brasileira dos Terminais Portuários (ABTP)
Associação Brasileira do Agronegócio (Abag)
Bonsucro – organization responsible for the certification of sustainability aspects in the production of sugarcane
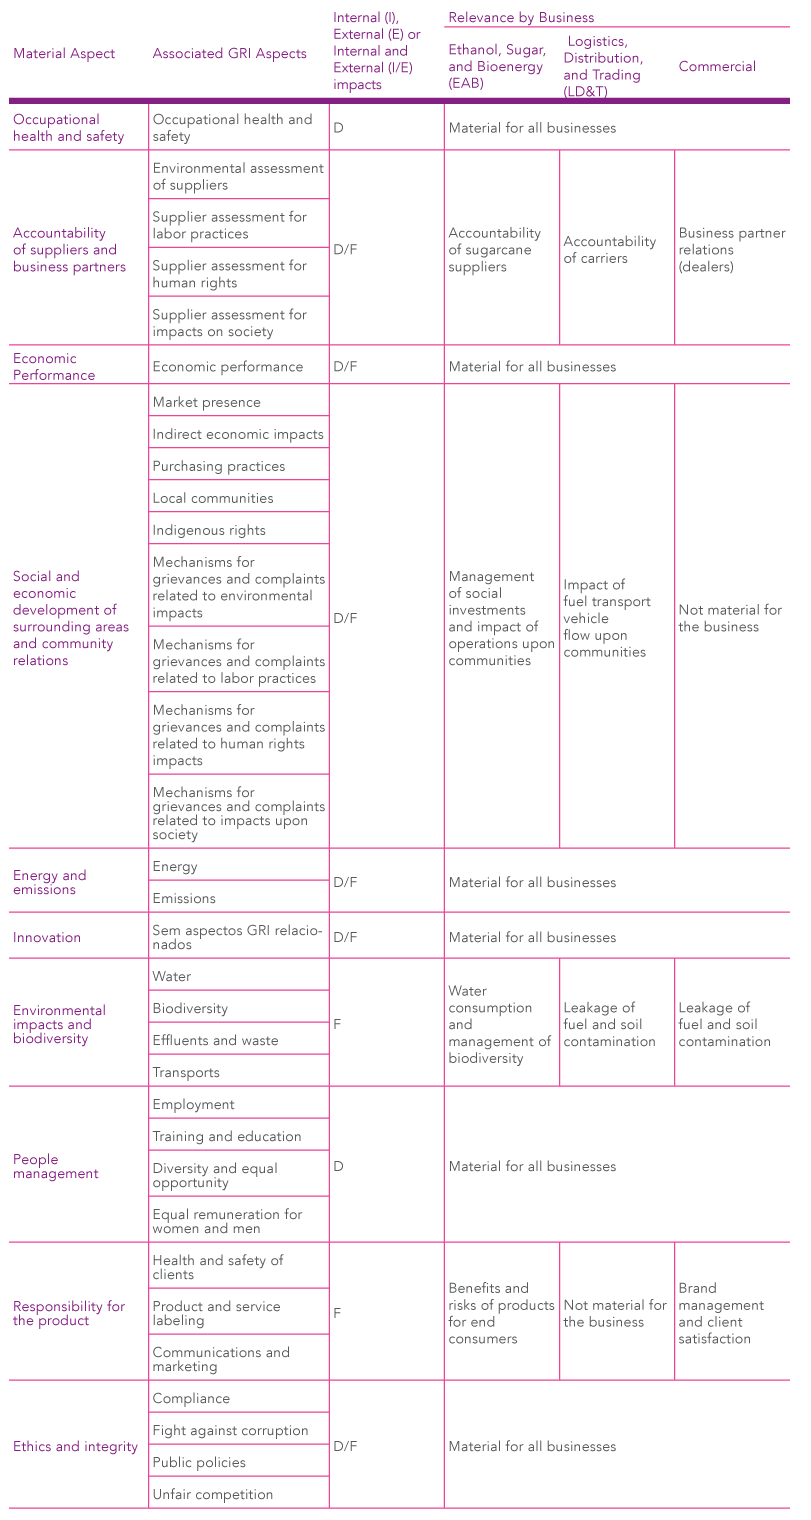
Material aspects identified in the process for defining report content
Material aspects within the organization
Material aspects outside the organization
Direct economic value generated and distributed
Raízen Energia
| 2015/2016 | 2016/2017 | |
| Revenues - Gross sales of products and services | 12,557,268 | 12,900,645 |
| Revenues - Returns of sales, discounts and abatements | (10,198) | (11,257) |
| Revenues - Reversal (constitution) of provisions for credits of doubtful debtors | (5,025) | (1,811) |
| Revenues - Other operating revenue (expenses) | 49,885 | 25,989 |
| Revenues - Total | 12,591,930 | 12,913,566 |
| Inputs acquired from third parties - Cost of products sold and services provided | (5,981,389) | (6,124,579) |
| Inputs acquired from third parties - Materials, energy, services provided by third parties, and others | (769,049) | (809,235) |
| Inputs acquired from third parties - Changes in the fair value of biological assets | 637,937 | 304,621 |
| Inputs acquired from third parties - Changes in the fair value of sugarcane harvested (Agricultural Product) | 0 | - |
| Inputs acquired from third parties - Constitution of provision for inventory obsolescence | (377) | (72,383) |
| Inputs acquired from third parties - Constitution (reversal) of estimated losses on investments, fixed and intangible assets, net | - | (156,200) |
| Inputs acquired from third parties - Total | (6,112,878) | (6,857,776) |
| Gross value added | 6,479,052 | 6,055,790 |
| Depreciation and amortization | (1,876,896) | (1,818,791) |
| Net value added produced | 4,602,156 | 4,236,999 |
| Value added received in transfers - Results of equity accounting | (73,260) | (69,635) |
| Value added received in transfers - Financial revenues | 664,798 | 665,347 |
| Currency variation | 195,862 | 2,706 |
| Gains in operations with derivatives | 668,922 | 736,068 |
| Value added received in transfers - Total | 1,456,322 | 1,334,486 |
| Value added for distribution | 6,058,478 | 5,571,485 |
| 2015/2016 | 2016/2017 | |
| Value added distribution Personnel - Direct remuneration | 1,273,054 | 1,234,931 |
| Value added distribution Personnel - Benefits | 236,691 | 276,800 |
| Value added distribution Personnel - FGTS (government severance fund) | 117,679 | 117,464 |
| Value added distribution Personnel - Total | 1,627,424 | 1,629,195 |
| Taxes, fees and contributions - Federal | 374,844 | 576,159 |
| Deferred federal taxes | 387,202 | 121,858 |
| Taxes, fees and contributions - State | 460,644 | 463,286 |
| Taxes, fees and contributions - Municipal | 2,572 | 8,158 |
| Taxes, fees and contributions - Total | 1,225,262 | 1,169,461 |
| Remuneration of third-party capital - Financial Expenses | 969,697 | 868,270 |
| Remuneration of third-party capital - Net currency variation | 637,387 | 70,870 |
| Losses in operations with financial instruments | 91,562 | 0 |
| Remuneration of third-party capital - Leases | 321,502 | 429,110 |
| Remuneration of third-party capital - Total | 2,020,148 | 1,368,250 |
| Remuneration of own capital - Dividends and interest on own capital | 9,865 | 211,636 |
| Remuneration of own capital - Retained earnings | 1,175,779 | 1,193,031 |
| Remuneration of own capital - Share of non-controlling shareholders in retained earnings | 0 | (88) |
| Remuneration of own capital - Total | 1,185,644 | 1,404,579 |
| Value added distributed | 6,058,478 | 5,571,485 |
Raízen Combustíveis
| 2015/2016 | 2016/2017 | |
| Revenues - Gross sales of products and services | 66,069,237 | 71,364,008 |
| Revenues - Returns of sales, discounts and abatements | (639,231) | (410,771) |
| Revenues - Reversal (constitution) of provisions for credits of doubtful debtors | (32,566) | (338,249) |
| Revenues - Other operating revenue (expenses) | 385,749 | 367,451 |
| Revenues - Total | 65,783,189 | 71,718,507 |
| Inputs acquired from third parties - Cost of products sold and services provided | (60,559,350) | (65,582,386) |
| Inputs acquired from third parties - Materials, energy, services provided by third parties, and others | (892,136) | (1,033,400) |
| Inputs acquired from third parties - Changes in the fair value of biological assets | 0 | 0 |
| Inputs acquired from third parties - Changes in the fair value of sugarcane harvested (Agricultural Product) | 0 | 0 |
| Inputs acquired from third parties - Constitution of provision for inventory obsolescence | 0 | 0 |
| Inputs acquired from third parties - Total | (61,451,486) | (66,615,786) |
| Gross value added | 4,331,703 | 5,102,721 |
| Depreciation and amortization | (533,255) | (538,317) |
| Net value added produced | 3,798,448 | 4,564,404 |
| Value added received in transfers - Results of equity accounting | 7,365 | (2,830) |
| Value added received in transfers - Financial revenues | 195,251 | 218,502 |
| Exchange rate variation active | 471,981 | 547,214 |
| Gains in operations with derivatives | 158,301 | 0 |
| Other amounts received in transfers | - | 156,189 |
| Value added received in transfers - Total | 832,898 | 919,075 |
| Value added for distribution | 4,631,346 | 5,483,479 |
| 2015/2016 | 2016/2017 | |
| Value added distribution Personnel - Direct remuneration | 272,222 | 272,357 |
| Value added distribution Personnel - Benefits | 47,822 | 56,143 |
| Value added distribution Personnel - FGTS (government severance fund) | 15,518 | 15,973 |
| Value added distribution Personnel - Total | 335,562 | 344,473 |
| Taxes, fees and contributions - Federal | 550,350 | 723,661 |
| Deferred federal taxes | - | - |
| Taxes, fees and contributions - State | 1,390,859 | 1,342,207 |
| Taxes, fees and contributions - Municipal | 10,346 | 12,886 |
| Other taxes and fees | 9,215 | |
| Taxes, fees and contributions - Total | 1,951,555 | 2,087,969 |
| Remuneration of third-party capital - Financial Expenses | 120,047 | 180,277 |
| Remuneration of third-party capital - Currency variation passive | 404,416 | 45,351 |
| Losses in operations with financial instruments | 564,227 | 1,022,426 |
| Remuneration of third-party capital - Leases | 55,063 | 54,260 |
| Change in the fair value of financial instruments - Expenses | - | 90,150 |
| Remuneration of third-party capital - Total | 1,143,753 | 1,392,464 |
| Remuneration of own capital - Dividends and interest on own capital | 953,164 | 1,431,000 |
| Remuneration of own capital - Retained earnings | 62,812 | 167,815 |
| Remuneration of own capital - Share of non-controlling shareholders in retained earnings | 184,500 | 59,758 |
| Remuneration of own capital - Total | 1,200,476 | 1,658,573 |
| Value added distributed | 4,631,346 | 5,483,479 |
Ratios of standard entry level wage by gender compared to local minimum wage at significant locations of operation
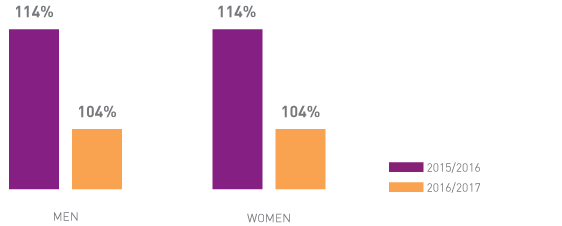
Our Remuneration and Benefits management controls a salary administration policy that, through market surveys, aims to keep the salary ranges attractive. We are committed to ensuring that the lowest amount paid is adhering to or above the wage floor of the prevailing trade union category.
In the 2016/2017 harvest, the lowest wage for men and women was equivalent to 104% of the national minimum wage, which ended 2016 at BRL 937.00, that is, the lowest wage offered by us was 1.04 time greater than the national minimum wage.
Development and impact of infrastructure investments and services provided
Our work in the communities around the facilities goes beyond the direct positive impacts of our operations. In some locations where there are hubs of the Raízen Foundation, we assess the needs of the community in relation to infrastructure and other aspects, but not in a systematic way. In the 2016/2017 harvest, more than BRL 14 million were invested in various social projects.
| 2015/2016 Harvest | 2016/2017 Harvest | |
| Educational projects | 337,000 | 225,000 |
| Social inclusion projects | 615,000 | 274,000 |
| Raízen Foundation projects | 333,000 | 309,000 |
| Training and professional inclusion | 21,000 | 5,000 |
| Volunteerism and internal campaigns | 171,000 | 196,000 |
| 2015/2016 Harvest | 2016/2017 Harvest | |
| Social consideration (partnership with BNDES)¹ | 4,398 | 1,992 |
| Incentivized projects² | 7,584 | 7,003 |
| Raízen Foundation³ | 4,848 | 5,098 |
| Total | 16,830 | 14,093 |
¹Investment made in infrastructure and hospital equipment.
²Social projects promoted by the Municipal Fund for the Rights of Children and Adolescents (FUMCAD) of the São Paulo City Hall; National Program for Cancer Care Support (PRONON); National Program to Support the Health of People with Disabilities (PRONAS/PCD); International Monetary Fund (IMF); Rouanet Law and Cultural Action Program (ProAC), of the Government of the State of São Paulo.
³Operation under the following pillars: professionalizing, social-educational, and education and citizenship projects and communities (free of charge).
Some of our production units also invest in the surrounding communities. The Mundial Unit, for example, invested BRL 105,000 in the recovery of bridges and municipal roads in the municipality of Mirandópolis (SP). The Junqueira Unit invested BRL 85,000 in an educational project lasting five months and more than BRL 76,000 in infrastructure (school reform and improvements in traffic). The Gasa Unit allocated BRL 18,000 to recover bridges in the municipalities of Andradina and Castilho (SP). The Destivale Unit invested BRL 9,000 in repairs on a bridge in the municipality of Tietê (SP). The Bonfim Unit spent more than BRL 430,000 in improvements on the roads and streets with traffic of sugarcane trucks, in order to mitigate potential risks associated with this traffic flow. The Barra Unit invested BRL 100,000 in donation of equipment to a hospital in the region. Finally, the Jataí Unit supported community events with BRL 24,000.
Proportion of spending on local suppliers at significant operating units
Our procurement practices are guided by our Procurement Policy and the Code of Conduct. All negotiations are approved in accordance with the Authority Manual, which sets out the approval purviews for the transactions. In addition, our procurement process is certified in the Quality Management System (ISO 9001) and Food Safety Management (FSSC 22000), which underscores the interaction between the internal processes, the concern with meeting customer requirements and the actions for continuous improvement.
In order to align suppliers' expectations, we hold off-season meetings in order to guarantee the service to maintain our production units. Quarterly, we send a Procurement Newsletter with topics that require the attention of suppliers, in addition to news to inform them about safe practices that make a difference in our operations. We disclose the Supply Quality Index (IQF) monthly and, when necessary, conduct face-to-face meetings to meet established criteria.
The supplier training process can occur in up to three stages according to scope of supply:
- 1st stage – Self-assessment questionnaire | The self-assessment is carried out in the Supplier Portal through the completion of a questionnaire with questions related to Health, Safety and Environment (HSE) and quality and techniques applied according to scope of supply. The acceptance criterion for this stage is to have a score 50% or above in the questionnaire.
- 2nd stage – Registry Assessment | Refers to the commercial analysis of the supplier, in which fiscal, financial, tax, labor and social responsibility aspects are verified according to established criteria. The supplier must obtain Good or Fair rating in this evaluation to be approved.
- 3rd stage – Execution of the Agreement | This stages involves the execution of the Agreement "General Terms and Conditions for Future and Possible Provision of Goods and Services" and of specific contracts agreed upon between the parties
We do not have in place specific policies to promote the economic inclusion of the selected suppliers. However, we strive to develop an increasingly effective relationship with the communities where we operate. To this end, we make a relevant effort to define our social performance strategy.
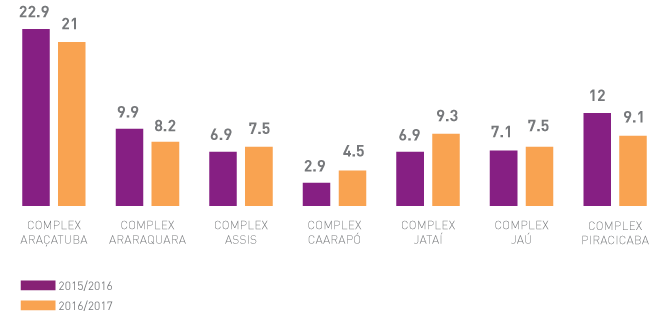
The local procurement and purchase department spent approximately BRL 3.56 billion on suppliers in the 2016/2017 harvest. Of this total, 10% were spent on local suppliers, since they are located in the same regional complexes where the production units are registered.
| 2015/2016 | 2016/2017* | |
| Araçatuba Complex | 22.9 | 21.0 |
| Araraquara Complex | 9.9 | 8.2 |
| Assis Complex | 6.9 | 7.5 |
| Caarapó Complex | 2.9 | 4.5 |
| Jataí Complex | 6.9 | 9.3 |
| Jaú Complex | 7.1 | 7.5 |
| Piracicaba Complex | 12.0 | 9.1 |
* Before the previous cycle, only the purchases of the production units were observed. In this cycle, all purchases made by Procurement were considered.
| 2016/2017 | |
| Amazonas (AM) | 43.7 |
| Ceará (CE) | 35.9 |
| Espírito Santo (ES) | 48.4 |
| Goiás (GO) | 22.1 |
| Minas Gerais (MG) | 26.5 |
| Paraná (PR) | 62.8 |
| Paraíba (PB) | 20.5 |
| Rio de Janeiro (RJ) | 26.8 |
| Rio Grande do Sul (RS) | 34.2 |
| São Paulo (SP) | 90.7 |
| Grand total | 78.4 |
*In the other States, Procurement spend on local suppliers was less than 20%.
Energy consumption within the organization
In 2016/2017, our energy consumption was 168,286,138.21 GJ, of which 7,812,670.54 GJ were sold through government or spot market auctions.
The largest portion of the energy consumed is renewable, totaling 93% of all our consumption, as shown below:
| 2014/2015 Harvest | 2015/2016 Harvest | 2016/2017 Harvest | |
| Sugarcane bagasse | 144,211,506.60 | 144,833,877.38 | 163,835,647.00 |
| Hydrous ethanol | 151,540.72 | 139,286.22 | 139,279.21 |
| Anhydrous ethanol | - | - | 217.02 |
| Biodiesel | - | - | 247,206.31 |
| Total energy consumption - renewable sources | 144,363,047.32 | 144,973,163.60 | 164,222,349.54 |
| Diesel B7 | 3,427,117.04 | 3,186,108.33 | 3,536,226.24 |
| Gasoline C | 2,271.15 | 2,062.30 | 863.89 |
| LPG | 123,942.26 | 158,770.71 | 11,770.62 |
| Heavy fuel oil | 19,763.81 | 16,326.96 | 14,967.35 |
| Total energy consumption - non-renewable sources | 3,573,094.26 | 3,363,268.30 | 3.563.828,10 |
| Electricity purchased utility companies | 531,965.60 | 477,676.80 | 499.960,57 |
| Total energy consumption | 148,468,107.18 | 148,814,108.70 | 168.286.138,21 |
¹Conversion factors available in the National Energy Balance were used for the calculation. The information is collected for the calculation of emissions using the methodology of the GHG Protocol and has been taken from the Report on Greenhouse Gas Emissions (GHG).
Energy consumption outside the organization
In the 2016/2017 harvest, 5,850,198.33 GJ1 in fuels were consumed by the carriers contracted.
The conversion factor available in the National Energy Balance was used for the calculation. The information is collected for the calculation of emissions using the methodology of the GHG Protocol and has been taken from the Report on Greenhouse Gas Emissions (GHG).
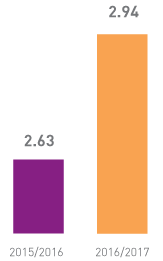
Energy intensity
In the 2016/2017 harvest, our energy intensity was 2.83 GJ consumed per ton of sugarcane crushed. The energy used to calculate the indicator included the energy consumed within the organization and the energy sold (from the burning of sugarcane bagasse). The types of energy included in the intensity rate were fuels and electricity from scopes 1 and 2 sources.
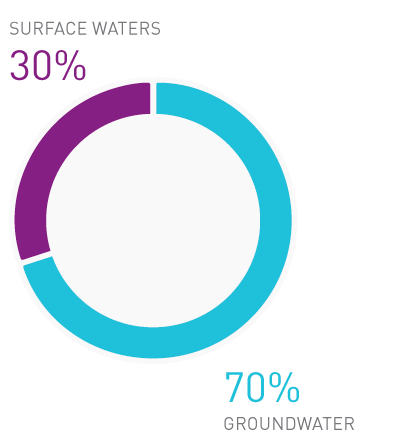
Total water withdrawal by source
In the 2016/2017 harvest, we withdrew 56,215,230 m3 of surface waters and groundwater to be used in industrial and irrigation processes, among other uses. This is our most significant consumption. Thus, other activities were not considered in the calculation of this indicator.
| Type of use | 2015/2016 Harvest | 2016/2017 Harvest |
| Industrial Use1 | 55,950,114 | 47,729,478 |
| Use in irrigation | 6,519,367 | 5,530,768 |
| Other uses2 | 13,271,159 | 2,954,984 |
| TOTAL | 75,740,640 | 56,215,230 |
| Surface waters | 63,445,313 | 39,077,636 |
| Groundwater | 12,295,327 | 17,137,593 |
1Total withdrawn as of 12/31/2016
2 Withdrawal from surface and groundwater sources for other uses: human consumption, administrative area, automotive workshop, lodging, farms, fueling stations, off-season, fire system, among others.
Operational units owned, leased, managed in, or adjacent to, protected areas and areas of high biodiversity value outside protected areas
We operate industrial units in the states of São Paulo, Mato Grosso do Sul and Goiás and in sugarcane cultivated areas leased from third parties in these states and in the state of Paraná. Of our 24 production units, 16 have already been certified in the Bonsucro standard, in addition to our second-generation ethanol plant, which also holds this certification.
The certification ensures that areas for planting sugarcane are not legally protected or classified as High Conservation Value Areas (HCVA) by means of an analysis of land use change.
There are also industrial and agricultural operations in the vicinity of protected areas or areas of high biodiversity value, but the location and size of these operations are confidential information. However, there is no planting of sugarcane in areas of high biodiversity value.
In order to obtain sustainability certifications, we conduct - with the assistance of a specialized and independent institution - a study to analyze the biodiversity of the areas where we grow sugarcane. As a result, it was shown that the areas of degraded pasture on which sugarcane began to be cultivated did not present high biodiversity value.
>Description of significant impacts of activities, products, and services on biodiversity in protected areas and areas of high biodiversity value outside protected areas
In the units certified by Bonsucro, we have in place an Environmental Management Plan (PGA), which aims to identify the impact of our activities on the environment, propose goals and manage actions to mitigate negative impacts.
Potential effects relate to interference in the dynamics of local wildlife due to the traffic of trucks and emissions of contaminants. In the agricultural area, the use of substances developed for pest control is essential to ensure greater productivity of sugarcane fields. However, without taking the necessary care, such application can be harmful. To minimize potential risks, we seek to use biological pest control whenever technically feasible.
Other relevant potential impacts associated with agricultural practices and that should be fought are loss of riparian vegetation – curbed by mapping the existing preservation areas on properties managed by the company – and the road kill mortality rate of animals, overfishing and poaching, which is mitigated through initiatives such as adequate signage on the prohibition of these practices and professional qualification.
We reduced the impact on the species that inhabit our areas of cultivation by mechanizing the harvest. As of 2017, pre-harvest burning was 100% extinct due to the voluntary commitments assumed in the signing of the Agro-environmental Protocol.
Direct Greenhouse Gas (GHG) emissions (Scope 1)
Indirect Greenhouse Gas (GHG) emissions from the acquisition of energy (Scope 2)
Other indirect Greenhouse Gas (GHG) emissions (Scope 3)
Total Scope 1 emissions in 2016 was 1,384,905.40 tons of carbon dioxide equivalent (CO2), considering the operational control approach, which includes emissions of any organizations and production units on which we have control or interference, although this control can be shared. The main sources of emissions in this scope are agricultural activities (use of field machinery, agricultural and industrial inputs) and biomass boilers that generate energy by burning sugarcane bagasse for the production of sugar and ethanol. Emissions from consumption of biomass are segmented between biogenic and non-biogenic. Biogenic emissions are considered neutral and accounted for separately, given the CO2 absorbed from the atmosphere in the photosynthesis process.
Emissions from the acquisition of energy are accounted for in Scope 2, and agricultural emissions and emissions from mobile sources, i.e. air travel, biomass burning in rural areas and third party vehicles were considered in Scope 3.
Gases considered in the calculation were: CO2, Methane (CH4), nitrous oxide (N2O), sulfur hexafluoride (SF6), nitrogen trifluoride (NF3) and the families of hydrofluorocarbon (HFC) and perfluorocarbons (PFC) gases. Emissions from NF3 and PFC gases are not applicable to our activities.
We consider 2013 as the base year for accounting for emissions since it better represents the scope of our activities. In that year, we incorporated into our inventory the emissions of vinasse and filter cake, which accounted for 14% and 18%, respectively, of total fertilizer emissions.
Calculation of GHG emissions was done according to the specifications of the Brazilian GHG Protocol Program - developed by the World Resources Institute (WRI) and the World Business Council for Sustainable Development (WBCSD) -, managed in Brazil by the Center for Sustainability Studies (GVces) of the Business Administration School of the Getulio Vargas Foundation; and standards NBR ABNT ISO 14.064-1 – guidance to quantify and report emissions and removal of greenhouse gases. Where applicable, the methodology also followed the determinations for calculations set out in the 2006 IPCC Guidelines for National GHG Inventories of the United Nations and in the Reference report of the Second National Inventory. The main sources of the emission factors used were:
- IPCC, 2006;
- Ministry of Science and Technology (MTC);
- US EPA Solid Waste Management and Greenhouse Gases, 2006;
- 2013 Guidelines to Defra / DECC's GHG Conversion Factors for Company Reporting;
- Australian National Greenhouse Accounts NGA Factors;
- Greenhouse gas emissions in the production and use of ethanol from sugarcane in Brazil: The 2005/2006 average and a prediction for 2020;
- Calculation tool of the GHG Protocol Agriculture Guidance;
- Second Inventory of Brazilian Anthropic Emissions of Greenhouse Gases Reference Reports of Nitrous Oxide Emissions from Agricultural Soils
- Internal studies by Raízen.
The global warming potential rates adopted as reference used the PAGs presented by the IPCC Fourth Assessment Report: Climate Change – Errata (2007) for a time span of 100 years.
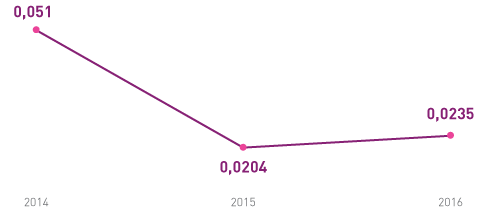
Intensity of Greenhouse Gas (GHG) emissions
In 2016, the overall intensity rate of our GHG emissions was 0.0235 tCO2eq and was determined from the summation of scope 1 and 2 emissions, divided by the total sugarcane crushed. The types of emission included in the intensity rate were: direct (Scope 1) and indirect from acquisition of energy (Scope 2). The GHGs included in the emission calculations are those controlled by the Kyoto Protocol: CO₂, CH₄, N₂O, SF6, NF3 and the families of HFC and PFC gases. Emissions from NF3 and PFCs are not applicable to our activities.
Intensity of greenhouse gas (GHG) emissions in tCO2eq per t of sugarcane crushed
Total number and volume of significant spills
In the 2016/2017 harvest, there were eight significant spill events in the distribution operations. Of these, two were in a contained area and the volume was fully recovered, and six were in a non-contained area, with a total volume of 141,300 liters. In commercial operations, a leakage occurred in a contained area (in excess of 100 liters), with volume fully recovered.
Since leakage of fuel may cause soil contamination, we monitor all spills in contained and non-contained areas, if greater than 100 liters. All leakages are monitored regardless of whether they are significant or not. All events are recorded, their causes are investigated and actions are planned to mitigate impacts and prevent recurrences.
No spill was reported in the financial statements since they were less than BRL 1 million.
Number of grievances about environmental impacts filed, addressed, and resolved through formal grievance mechanisms
We received grievances and complaints by telephone calls to the Customer Service Department (SAC) and Ombudsman's Office, digital social media, website and e-mail. Upon receiving a complaint from the community, we register the call and forward it to the Communication area, which conducts the appropriate analysis and returns within five working days for subsequent return to the requesting party. If necessary, the Legal area is involved.
In the 2016/2017 harvest, 32 complaints related to environmental issues were received by the Customer Service Department. They were all processed and resolved in the same period. Of the complaints, 4 refer to service stations and 28 to damages and pollution.
Total number and rates of new employee hires and employee turnover by age group, gender and region
| 2014/2015 Harvest | 2015/2016 Harvest | 2016/2017 Harvest | ||||
| Gender | Including harvest workers | Not including harvest workers | Including harvest workers | Not including harvest workers | Including harvest workers | Not including harvest workers |
| Male | 8,340 | 3,548 | 10,370 | 4,399 | 2,506 | 824 |
| Female | 1,222 | 704 | 1,188 | 627 | 106 | 65 |
| 2014/2015 Harvest | 2015/2016 Harvest | 2016/2017 Harvest | ||||
| Age group | Including harvest workers | Not including harvest workers | Including harvest workers | Not including harvest workers | Including harvest workers | Not including harvest workers |
| Under 20 | 1,195 | 550 | 916 | 363 | 129 | 35 |
| Between 21 and 30 | 3,905 | 1,861 | 4,287 | 1,928 | 861 | 290 |
| Between 31 and 40 | 2,648 | 1,167 | 3,656 | 1,604 | 916 | 326 |
| Between 41 and 50 | 1,330 | 522 | 1,981 | 848 | 536 | 182 |
| Between 51 and 60 | 467 | 150 | 712 | 282 | 169 | 56 |
| Over 60 | 17 | 2 | 6 | 1 | 1 | 0 |
| 2014/2015 Harvest | 2015/2016 Harvest | 2016/2017 Harvest | ||||
| Region | Including harvest workers | Not including harvest workers | Including harvest workers | Not including harvest workers | Including harvest workers | Not including harvest workers |
| South | 38 | 38 | 36 | 36 | 3 | 3 |
| Southeast | 8,885 | 3,679 | 11,015 | 4,483 | 2,511 | 788 |
| Midwest | 565 | 461 | 454 | 454 | 91 | 91 |
| Northeast | 42 | 42 | 25 | 25 | 2 | 2 |
| North | 32 | 32 | 28 | 28 | 5 | 5 |
| 2014/2015 Harvest | 2015/2016 Harvest | 2016/2017 Harvest | ||||
| Gender | Including harvest workers | Not including harvest workers | Including harvest workers | Not including harvest workers | Including harvest workers | Not including harvest workers |
| Male | 0.31 | 0.14 | 0.42 | 0.20 | 0.11 | 0.04 |
| Female | 0.30 | 0.19 | 0.33 | 0.19 | 0.03 | 0.02 |
*Rate of new hires = number of new hires/average number of active employees in the crop year. The 2016/2017 harvest considered employees who were hired and active in the month of March 2017, different from the other harvests, which considered the height of the harvest.
| 2014/2015 Harvest | 2015/2016 Harvest | 2016/2017 Harvest | ||||
| Age group | Including harvest workers | Not including harvest workers | Including harvest workers | Not including harvest workers | Including harvest workers | Not including harvest workers |
| Under 20 | 1.15 | 0.77 | 1.19 | 0.68 | 0.30 | 0.10 |
| Between 21 and 30 | 0.41 | 0.23 | 0.51 | 0.27 | 0.11 | 0.04 |
| Between 31 and 40 | 0.28 | 0.13 | 0.41 | 0.20 | 0.10 | 0.04 |
| Between 41 and 50 | 0.19 | 0.08 | 0.32 | 0.15 | 0.09 | 0.03 |
| Between 51 and 60 | 0.12 | 0.04 | 0.21 | 0.09 | 0.05 | 0.02 |
| Over 60 | 0.03 | 0.00 | 0.01 | 0.00 | 0.00 | 0.00 |
| 2014/2015 Harvest | 2015/2016 Harvest | 2016/2017 Harvest | ||||
| Region | Including harvest workers | Not including harvest workers | Including harvest workers | Not including harvest workers | Including harvest workers | Not including harvest workers |
| South | 0.15 | 0.15 | 0.15 | 0.15 | 0.01 | 0.01 |
| Southeast | 0.31 | 0.14 | 0.42 | 0.19 | 0.10 | 0.03 |
| Midwest | 0.32 | 0.29 | 0.33 | 0.35 | 0.07 | 0.07 |
| Northeast | 0.21 | 0.21 | 0.11 | 0.11 | 0.01 | 0.01 |
| North | 0.33 | 0.33 | 0.25 | 0.25 | 0.04 | 0.04 |
| 2016/2017 Harvest | ||
| Gender | Including harvest workers | Not including harvest workers |
| Men | 5 | 3 |
| Women | 0 | 0 |
| 2016/2017 Harvest | ||
| Age group | Including harvest workers | Not including harvest workers |
| Under 20 | 0 | 0 |
| Between 21 and 30 | 4 | 3 |
| Between 31 and 40 | 0 | 0 |
| Between 41 and 50 | 1 | 0 |
| Between 51 and 60 | 0 | 0 |
| Over 60 | 0 | 0 |
| 2016/2017 Harvest | ||
| Region | Including harvest workers | Not including harvest workers |
| South | 0 | 0 |
| Southeast | 5 | 3 |
| Midwest | 0 | 0 |
| Northeast | 0 | 0 |
| North | 0 | 0 |
| 2014/2015 Harvest | 2015/2016 Harvest | 2016/2017 Harvest | ||||
| Gender | Including harvest workers | Not including harvest workers | Including harvest workers | Not including harvest workers | Including harvest workers | Not including harvest workers |
| Male | 12,754 | 8,017 | 10,053 | 6,142 | 289 | 287 |
| Female | 2,090 | 1,498 | 1,360 | 1,057 | 50 | 50 |
| 2014/2015 Harvest | 2015/2016 Harvest | 2016/2017 Harvest | ||||
| Age group | Including harvest workers | Not including harvest workers | Including harvest workers | Not including harvest workers | Including harvest workers | Not including harvest workers |
| Under 20 | 920 | 407 | 521 | 226 | 3 | 3 |
| Between 21 and 30 | 5,296 | 3,163 | 3,691 | 2,138 | 124 | 124 |
| Between 31 and 40 | 4,397 | 2,931 | 3,361 | 2,049 | 102 | 102 |
| Between 41 and 50 | 2,598 | 1,758 | 2,256 | 1,505 | 44 | 44 |
| Between 51 and 60 | 1,365 | 1,006 | 1,273 | 976 | 51 | 51 |
| Over 60 | 268 | 250 | 311 | 305 | 15 | 15 |
| 2014/2015 Harvest | 2015/2016 Harvest | 2016/2017 Harvest | ||||
| Region | Including harvest workers | Not including harvest workers | Including harvest workers | Not including harvest workers | Including harvest workers | Not including harvest workers |
| South | 97 | 97 | 35 | 35 | 3 | 3 |
| Southeast | 13,755 | 8,657 | 10,703 | 6,580 | 296 | 296 |
| Midwest | 948 | 717 | 635 | 544 | 33 | 33 |
| Northeast | 23 | 23 | 21 | 21 | 1 | 1 |
| North | 21 | 21 | 19 | 19 | 6 | 6 |
| 2014/2015 Harvest | 2015/2016 Harvest | 2016/2017 Harvest | ||||
| Gender | Including harvest workers | Not including harvest workers | Including harvest workers | Not including harvest workers | Including harvest workers | Not including harvest workers |
| Male | 0.39 | 0.24 | 0.42 | 0.24 | 0.06 | 0.03 |
| Female | 0.40 | 0.29 | 0.35 | 0.25 | 0.02 | 0.02 |
*Turnover rate = (number of hires + number of terminations)/2/average number of active employees in the crop year. The 2016/2017 harvest considered employees who were hired and active in the month of March 2017, different from the other harvests, which considered the height of the harvest.
| 2014/2015 Harvest | 2015/2016 Harvest | 2016/2017 Harvest | ||||
| Age group | Including harvest workers | Not including harvest workers | Including harvest workers | Not including harvest workers | Including harvest workers | Not including harvest workers |
| Under 20 | 1.02 | 0.67 | 0.94 | 0.55 | 0.15 | 0.06 |
| Between 21 and 30 | 0.49 | 0.30 | 0.48 | 0.28 | 0.06 | 0.03 |
| Between 31 and 40 | 0.37 | 0.23 | 0.39 | 0.23 | 0.06 | 0.03 |
| Between 41 and 50 | 0.29 | 0.18 | 0.35 | 0.21 | 0.05 | 0.02 |
| Between 51 and 60 | 0.24 | 0.16 | 0.29 | 0.19 | 0.03 | 0.02 |
| Over 60 | 0.23 | 0.21 | 0.32 | 0.31 | 0.02 | 0.02 |
| 2014/2015 Harvest | 2015/2016 Harvest | 2016/2017 Harvest | ||||
| Region | Including harvest workers | Not including harvest workers | Including harvest workers | Not including harvest workers | Including harvest workers | Not including harvest workers |
| South | 0.27 | 0.27 | 0.15 | 0.15 | 0.01 | 0.01 |
| Southeast | 0.39 | 0.24 | 0.41 | 0.24 | 0.06 | 0.02 |
| Midwest | 0.42 | 0.37 | 0.40 | 0.38 | 0.05 | 0.05 |
| Northeast | 0.16 | 0.16 | 0.11 | 0.11 | 0.02 | 0.05 |
| North | 0.27 | 0.27 | 0.21 | 0.21 | 0.02 | 0.02 |
Percentage of total workforce represented in formal health and safety committees, composed of employees of different hierarchical levels, who help monitor and advise on occupational health and safety programs
All our employees are represented in formal health and safety committees. In the production operations2, the committees involve mainly the management areas. In logistics and commercial operations3, several employment levels are involved, as described below:
Logistics:
- Corporate HSE Committee: President, Vice Presidents, Directors, Managers and other representatives of HSE and of the operational areas;
- HSE Committee Operations: HSE Manager Operations, Operations Managers, HSE Advisors, Operations Director, Operations Managers, Operations Support Group and other representatives as needed;
- HSE Committee Transportation: Logistics Director, Transportation Manager, Transportation Advisors, HSE Transportation Coordinator and Advisors and other representatives as needed;
- Internal HSE Committee (CISSMA), per terminal: Manager, superintendent, employees, and terminal contractors.
Commercial:
- Corporate HSE Committee: President, Vice Presidents, Directors, Managers and other representatives of HSE and operational areas;
- Commercial HSE Committee (MTC): Commercial VP, HSE Directors, Sales, Retail, B2B, Engineering, Finance and Aviation;
- Operational Commercial HSE Committee: HSE Directors, HR and other appointed directors, HSE Manager;
- Light Fleet Committee: Representatives of administration (directors).
2 Ethanol, Sugar, and Bioenergy (EAB)
3 Logistics, Distribution, and Trading (LD&T), and Commercial
Types and rates of injuries, occupational diseases, lost days, absenteeism and number of work-related fatalities, by region and gender
Our health and safety indicators follow the NBR 14280 and OSHA 3245 standards. Data by gender are not made available because our management does not consider such classification internally. Minor injuries (first aid) are not considered in the Lost Time Injury Frequency (LTIF) and Total Recordable Case Frequency (TRCF) indices. However, they are monitored and tracked.
In production operations (EAB)
| 2015/2016 Harvest | 2016/2017 Harvest | |
| Lost time injury frequency for own employees and contractors - LTIF/TF | 0.28 | 0.18 |
| Total Recordable Case Frequency (with and without lost time, except first aid) for own employees and contractors - TRCF/TAR | 1.73 | 1.34 |
| 2015/2016 Harvest | 2016/2017 Harvest | |
| Araçatuba | 0.18 | 0.05 |
| Araraquara | 0.28 | 0.50 |
| Assis | 0.83 | 0.09 |
| Jaú | 0.21 | 0.25 |
| Piracicaba | 0.13 | 0 |
| Corporate | 0 | 0 |
| 2015/2016 Harvest | 2016/2017 Harvest | |
| Araçatuba | 1.57 | 1.43 |
| Araraquara | 1.99 | 1.66 |
| Assis | 2.5 | 0.98 |
| Jaú | 1.83 | 1.71 |
| Piracicaba | 1.22 | 1.04 |
| Corporate | 0.29 | 0.25 |
| 2015/2016 Harvest | 2016/2017 Harvest | |
| Araçatuba | 0 | 0 |
| Araraquara | 1 | 0 |
| Assis | 0 | 0 |
| Jaú | 1 | 1 |
| Piracicaba | 0 | 0 |
| Corporate | 0 | 0 |
In logistics and distribution operations (LD&T)
| 2015/2016 Harvest | 2016/2017 Harvest | |
| Lost time injury frequency for own employees and contractors - LTIF/TF | 0.06 | 0.06 |
| Total Recordable Case Frequency (with and without lost time, except first aid) for own employees and contractors - TRCF/TAR | 0.13 | 0.33 |
There were no fatalities in the period and the accident with lost time occurred in Rondonópolis. TRCF was not broken down by region.
In commercial operations
| 2015/2016 Harvest | 2016/2017 Harvest | |
| Lost time injury frequency for own employees and contractors - LTIF/TF | 0 | 0 |
| Total Recordable Case Frequency (with and without lost time, except first aid) for own employees and contractors - TRCF/TAR | 1.09 | 0 |
There were no fatalities in the period.
Health management
| 2015/2016 Harvest | 2016/2017 Harvest1 | |||||
| EAB | LD&T | Commercial | EAB | LD&T | Commercial | |
| Rate of occupational diseases for own employees | 6.46 | 0 | 0 | 6.62 | 0 | 0 |
| Total number of lost days for own employees | 2.125 | 0 | 0 | 2.442 | 0 | 0 |
| Absenteeism rate for own employees | 0.96 | 0 | 0 | 0.83 | N/D | N/D |
1Data not available for logistics, distribution and commercial operations, but they are already being recorded and will be reported starting next harvest.
| 2015/2016 Harvest | 2016/2017 Harvest | |||||
| EAB | LD&T | Commercial | EAB | LD&T | Commercial | |
| Female | 0 | 0 | 0 | 0 | 0 | 0 |
| Male | 6.62 | 0 | 0 | 7.51 | 0 | 0 |
| South | 0 | 0 | 0 | 0 | 0 | 0 |
| Southeast | 6.62 | 0 | 0 | 6.97 | 0 | 0 |
| Midwest | 0 | 0 | 0 | 0 | 0 | 0 |
| Northeast | 0 | 0 | 0 | 0 | 0 | 0 |
| North | 0 | 0 | 0 | 0 | 0 | 0 |
| 2015/2016 Harvest | 2016/2017 Harvest | |||||
| EAB | LD&T | Commercial | EAB | LD&T | Commercial | |
| Female | 1,713 | 0 | 0 | 89 | 0 | 0 |
| Male | 214 | 0 | 0 | 2,353 | 0 | 0 |
| South | 0 | 0 | 0 | 0 | 0 | 0 |
| Southeast | 1,796 | 0 | 0 | 2,426 | 0 | 0 |
| Midwest | 131 | 0 | 0 | 16 | 0 | 0 |
| Northeast | 0 | 0 | 0 | 0 | 0 | 0 |
| North | 0 | 0 | 0 | 0 | 0 | 0 |
| 2015/2016 Harvest | 2016/2017 Harvest1 | |||||
| EAB | LD&T | Commercial | EAB | LD&T | Commercial | |
| Female | 0.21 | 0 | 0 | 1.62 | ||
| Male | 0.69 | 0 | 0 | 0.73 | ||
| South | 0 | 0 | 0 | 0 | ||
| Southeast | 0.81 | 0 | 0 | 0.80 | ||
| Midwest | 0.08 | 0 | 0 | 1.37 | ||
| Northeast | 0 | 0 | 0 | 0 | ||
| North | 0 | 0 | 0 | 0 | ||
1Data not available for logistics, distribution and commercial operations, but they are already being recorded and will be reported starting next harvest.
Our management does not monitor the rates of absenteeism or total number of lost days for contractors.
Average number of training hours per year per employee, broken down by gender, and by employee category
In the 2016/2017 harvest, we offered an average of 26.7 training hours for men and 12.0 for women. Training totaled more than 808,000 hours, offered through more than 2,800 training sessions.
| 2014/2015 Harvest | 2015/2016 Harvest | 2016/2017 Harvest | |
| Men | 23.3 | 28.8 | 26.7 |
| Women | 12.4 | 13.1 | 12.0 |
| 2014/2015 Harvest | 2015/2016 Harvest | 2016/2017 Harvest | |
| Apprentice | 0.77 | 0 | 0.65 |
| Operation | 7.04 | 2.61 | 4.17 |
| Production | 23.73 | 29.55 | 27.88 |
| Administration | 9.67 | 9.81 | 8.49 |
| Coordination/Supervision | 10.26 | 19.17 | 11.14 |
| Management | 7.66 | 14.43 | 8.56 |
| Directors | 2.26 | 0.82 | 4.06 |
| Vice Presidency | 0.50 | 0 | 0 |
| Presidency | 0 | 0 | 0 |
Employees working in logistics and distribution operations received additional 12,108 hours of classroom training and 5,350 hours of online training.
In the commercial operations, there were 10,107 hours of classroom training and 4,512 hours of online training, totaling 14,619 hours to these employees. For third parties in this area, we offered 150,686 hours of classroom training and 31,598 hours of online training. Most of these participants are fuel station dealers, convenience store franchisees and their teams.
| 2015/2016 | 2016/2017 | |
| Number of professionals served by the Leadership Academy | 179 | 381 |
| Number of training courses taught through the Skills Cycle | 23 | 15 |
| Number of employees served by scholarships and courses for professional development | 153 | 1.007 |
| Total number of classroom training hours offered to all employees | 964,624 | 808,683 |
Percentage of employees receiving regular performance and career development reviews, by gender and employee category
In the 2016/2017 harvest, 10% of the male employees and 27% of the female employees received performance and career development review. Below is the breakdown by employee category:
| 2014/2015 Harvest | 2015/2016 Harvest | 2016/2017 Harvest | |
| Men | 8 | 9 | 10 |
| Women | 16 | 22 | 27 |
| 2014/2015 Harvest | 2015/2016 Harvest | 2016/2017 Harvest | |
| Apprentice | 0 | 0 | 0 |
| Operation | 96 | 88 | 89 |
| Production | 0 | 0 | 0 |
| Administration | 53 | 62 | 61 |
| Coordination/Supervision | 100 | 100 | 99 |
| Management | 100 | 100 | 100 |
| Directors | 100 | 100 | 100 |
| Vice Presidency | 9 | 100 | 100 |
| Presidency | 100 | 100 | 100 |
Composition of governance bodies and breakdown of employees by employee category according to gender, age group, minority group membership, and other indicators of diversity
| Under 20 | Between 21 and 30 | Between 31 and 40 | Between 41 and 50 | Between 51 and 60 | Over 60 | Total | ||
| Administration | Men | 0 | 2.9 | 2.7 | 1.0 | 0.5 | 0.1 | 7.2 |
| Women | 0.1 | 2.5 | 1.9 | 0.4 | 0.1 | 0 | 5 | |
| Apprentice | Men | 0 | 0 | 0 | 0 | 0 | 0 | 0 |
| Women | 0 | 0 | 0 | 0 | 0 | 0 | 0 | |
| Coordination/Supervision | Men | 0 | 0.3 | 1.0 | 0.4 | 0.2 | 0 | 1.9 |
| Women | 0 | 0.1 | 0.3 | 0.1 | 0 | 0 | 0.5 | |
| Directors | Men | 0 | 0 | 0 | 0.1 | 0 | 0 | 0.1 |
| Women | 0 | 0 | 0 | 0 | 0 | 0 | 0 | |
| Management | Men | 0 | 0 | 0.3 | 0.3 | 0.1 | 0 | 0.7 |
| Women | 0 | 0 | 0.1 | 0.1 | 0 | 0 | 0.2 | |
| Operation | Men | 0 | 0.6 | 0.9 | 0.5 | 0.2 | 0 | 2.2 |
| Women | 0 | 0 | 0 | 0 | 0 | 0 | 0 | |
| Presidency | Men | 0 | 0 | 0 | 0 | 0 | 0 | 0 |
| Women | 0 | 0 | 0 | 0 | 0 | 0 | 0 | |
| Production | Men | 1.2 | 18.0 | 22.4 | 17.8 | 11.5 | 3.2 | 74.1 |
| Women | 0.1 | 2.0 | 2.4 | 1.9 | 1.0 | 0.3 | 7.7 | |
| Vice Presidency | Men | 0 | 0 | 0 | 0 | 0 | 0 | 0 |
| Women | 0 | 0 | 0 | 0 | 0 | 0 | 0 | |
| Grand total | Men | 1.2 | 21.8 | 27.3 | 20.1 | 12.5 | 3.3 | 86.2 |
| Women | 0.2 | 4.6 | 4.7 | 2.5 | 1.1 | 0.3 | 13.4 | |
| Total | 1.4 | 26.4 | 32.0 | 22.6 | 13.6 | 3.6 | 1001 | |
1Since only one decimal place was used in the table, the sum may not total exactly 100%.
| 2015/2016 Harvest | 2016/2017 Harvest | |
| Administration | 1.0 | 2.6 |
| Men | 1.6 | 2.8 |
| Women | 1.4 | 2.2 |
| Coordination/Supervision | 0.3 | 0.3 |
| Men | 0.2 | 0.2 |
| Women | 0.8 | 0.6 |
| Directors | 0 | 0 |
| Men | 0 | 0 |
| Women | 0 | 0 |
| Management | 0.4 | 0.4 |
| Men | 0.4 | 0.4 |
| Women | 0 | 0 |
| Operation | 0.2 | 0.4 |
| Men | 0 | 0.4 |
| Women | 0.2 | 0 |
| Presidency | 0 | 0 |
| Men | 0 | 0 |
| Women | 0 | 0 |
| Production | 1.2 | 1.6 |
| Men | 1.1 | 1.5 |
| Women | 2.0 | 2.6 |
| Vice Presidency | 0 | 0 |
| Men | 0 | 0 |
| Women | 0 | 0 |
| Grand total | 2.0 | 1.7 |
| 2016/2017 Harvest | |
| Men | 86.5 |
| Women | 13.5 |
| Men | Women | Total | |
| Under 20 | 0 | 0 | 0 |
| Between 21 and 30 | 2.7 | 0 | 2.7 |
| Between 31 and 40 | 29.7 | 10.8 | 40.5 |
| Between 41 and 50 | 32.4 | 0 | 32.4 |
| Between 51 and 60 | 21.6 | 2.7 | 24.3 |
| Over 60 | 0 | 0 | 0 |
| Total | 86.5 | 13.5 | 100 |
Ratio of basic salary and remuneration of women to men by employee category, by significant locations of operation
Our Remuneration and Benefits Management controls a salary management policy that does not distinguish gender and assesses the scope of the job position and its positioning in the market and applies the corresponding salary bands. Administrative offices, production units, terminals and airports were considered for the following indicator.
| Salaries - 2014/2015 Harvest | Remunerations - 2014/2015 Harvest | Salaries - 2015/2016 Harvest | Remunerations - 2015/2016 Harvest | Salaries - 2016/2017 Harvest | Remunerations - 2016/2017 Harvest | |
| Apprentice1 | - | - | - | - | - | - |
| Operation | 101 | 98 | 102 | 111 | 102 | 105 |
| Production | 73 | 72 | 73 | 58 | 79 | 67 |
| Administration | 72 | 70 | 70 | 66 | 72 | 65 |
| Coordination/Supervision | 95 | 93 | 96 | 96 | 93 | 94 |
| Management | 93 | 95 | 95 | 94 | 90 | 81 |
| Directors | 84 | 52 | 83 | 67 | 75 | 54 |
| Vice Presidency | 90 | 96 | 76 | 70 | 82 | 88 |
| Presidency1 | - | - | - | - | - |
1Data for these categories is not available because there are no women holding these positions.
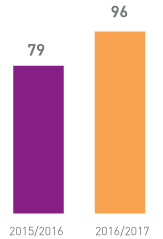
Number of grievances related to labor practices filed, processed and solved through formal grievance mechanisms
In the 2016/2017 harvest, we received 96 grievances related to labor practices, of which 83 were solved in the period. Most grievances are related to aspects such as working conditions, safety, and shift changes.
| 2015/2016* | 2016/2017 | |
| Filed | 79 | 96 |
| Addressed | - | 96 |
| Solved, received in the harvest | - | 83 |
| Solved, received in other harvests | - | 9 |
* In the period, grievances were not broken down in this manner.
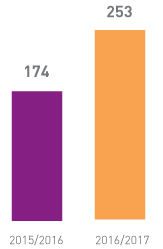
Number of grievances about human rights impacts filed, addressed, and solved through formal mechanisms
In the 2016/2017 harvest, we received 253 grievances and complaints related to human rights impacts, of which 137 were sent to the Ethics Channel and 116 to the Legal-Labor area. 121 of these records were solved in the period. Most grievances are related to discrimination, mobbing and sexual harassment.
In order to manage this aspect and avoid new cases, we offer managers training that explains our principles and values set forth in the Code of Conduct.
| 2015/2016 | 2016/2017 | |
| Filed | 174 | 253 |
| Addressed | 174 | 409 |
| Solved, received in the harvest | 102 | 121 |
| Solved, received in other harvests | 13 | 41 |
Percentage of operations with implemented local community engagement, impact assessments, and development programs
Through the Social Responsibility area and the Raízen Foundation, we conduct various programs for engaging the surrounding communities and for local development. For the most part, they are education and citizenship projects that contribute to social transformation and increase of employability in the regions where we operate. In the 2016/2017 harvest, we initiated the project Mulheres que Inspiram (Women Who Inspire), an initiative that promotes rounds of discussion and lectures on diversity and women's health.
On average, 44% of our operations undertake programs for engaging surrounding communities and assessing impacts. Another 24% create programs for local development.
| Project | Offices | Production units | Distribution terminals | Airports |
| Energia em Cena (Energy on Stage) | 67% | 63% | 19% | 12% |
| Amigo Leal (Loyal Friend) | 100% | 33% | 0% | 0% |
| Music and Citizenship | 0% | 4% | 0% | 0% |
| Winter Clothes Drive | 100% | 96% | 14% | 5% |
| Christmas Campaign | 100% | 100% | 22% | 2% |
| Projects originating from the incentives acts | 67% | 42% | 11% | 6% |
| Professional training courses | 33% | 42% | 0% | 0% |
| Volunteering | 100% | 8% | 2% | 0% |
| Projects derived from investments from the National Bank for Economic and Social Development (BNDES) | 0% | 46% | 3% | 0% |
In addition to the work conducted by the Raízen Foundation, we address demands from stakeholders, with a more reactive response to leave the risk zone once the problem is already installed. In order to fully advance in the stages, it is instrumental to improve the relationship with stakeholders, intensifying the dialogue and addressing relevant issues in a transparent manner. We are considering hiring a consulting firm to support the development of tools and mechanisms for the implementation of guidelines for Local Engagement with Stakeholders in plants, terminals and, subsequently, airports. Systems for addressing demands and strengthening an internal information network are also under analysis. The goal is to reach the second generation of relationship in the 2021/2022 harvest, and the third in 2025/2026.
Operations with significant actual and potential negative impacts on local communities
We are one of the most competitive energy companies in the world and we are among the five largest in the country in revenue. Our operations interact with the communities in the localities in which they are inserted. All production units, terminals and airports analyze the risk of potentially negative social impacts. As an example, our business involves logistics of inputs and products, which implies traffic of trucks throughout the Brazilian highway network.
Specifically in logistics operations, fuel tanker trucks (ethanol and gasoline) operate on highways and cities, and some of our 67 distribution terminals are located near or within municipalities. In order to mitigate possible problems inherent to this flow and to the location of our operations, we developed contingency plans, established strict safety standards and have in place a control center - which, in addition to guaranteeing safe delivery of products, optimizes processes and contributes to fuel economy and to reducing emissions of contaminants.
In production and industrial operations, sugarcane trucks travel the highways of the states of São Paulo, Goiás and Mato Grosso do Sul - where our 24 production units are located. The most recurring problems of this process are: dust and the high speed of these vehicles that travel in rural roads and highways. We now have monitoring conducted by Pentágono, which optimizes the logistics of these trucks. As a result of a more efficient fleet, the equipment becomes more productive and spends less time with the engine on and idle, which reduces consumption of diesel and emission of contaminants.
At the beginning of the harvest, we receive complaints regarding the noise from boiler tests. To anticipate to these problems, front-line teams take part in initiatives to visit the neighbors around our operations. Problems such as dust come to the company's knowledge via Raízen's customer service (SAC) and are forwarded to the responsible teams and to the appropriate places to evaluate and solve them. Participation in working groups with entities in society is also a routine task.
Another potentially negative impact is the closure of a production unit in cities with a low population, since the operation usually employs a lot of labor, and layoffs can have a significant economic impact on the location.
The 66 aircraft fuel bases - located in the most strategic airports in the country - operate according to the rules of the Brazilian Airport Infrastructure Company (Infraero), under strict safety standards. The critical problems related to the production units are mapped and sent to the knowledge of senior management.
Total number and percentage of operations assessed for risks related to corruption and the significant risks identified
We are signatories to the Ethos Institute's Anti-Corruption Pact and we participate in forums that encourage the strengthening of corporate governance, compliance and fight against corruption.
We also have a channel for reporting conflicts of interest, internal and external audits, procedures for evaluating exposure to risks related to this aspect.
Through the Ethics Channel, 38 cases related to corruption were recorded in the 2016/2017 harvest.
Among the main risks identified in these cases are: receiving bribes in purchase contracts, paying bribes in sales contracts, paying for facilitations by contractors that represent public agents to obtain certificates and improper relationship with agents and authorities.
Communication and training on anti-corruption policies and procedures
We have in place a Social Performance Policy, which provides on the need for approval of projects at various levels (including compliance). In addition, the receiving entity is verified, including about the existence of a possible ongoing process or request for a license/authorization - in these cases donation or sponsorship is not allowed.
For the groups that are more exposed to risks - in addition to online training and anti-corruption policy - the Compliance team conducts classroom training in order to answer questions and reinforce our guidelines and our commitment to fighting corruption.
These training courses are provided whenever an employee joins our team and are repeated every two years. All employees, as well as High Governance members, were informed about our anti-corruption policies and received training on the subject.
Number of grievances related to impacts on society filed, addressed, and resolved through formal grievance mechanisms
In the 2016/2017 harvest, we received, through Customer Service (SAC), 106 complaints related to impacts on society. They were all filed and solved in the same period. Of the grievances, 63 relate to the transportation of products and raw materials and 43 to noise and installations at the stations.